At HWFO we try to make complex mathematical concepts simple by using creative units and rate comparisons. Variously, we’ve visualized the costs of all government programs in units of “one border wall,” visualized the amount of CO2 averted by nuclear power in units of hot air balloons, visualized instances of natural disasters and civil unrest in units of one “mostly peaceful summer of 2020,” and similar. We also did the thing nobody else seemed to want to do during Covid, by comparing infection fatality rates of the disease against influenza by age bracket, to show how it was definitely more deadly than the flu to old people, but much safer for young people.
We’re also pro-gun around here, so I thought it might be instructive to compare the “danger” of sending your child to grade school against the danger of doing something everyone seems to do with no qualms in the modern age - board an airplane.
Grade School Spree Shooter Math
Good statistics about school shootings are hard to come by, because the antigun crowd pollutes the numbers whenever possible. For instance, a widely cited website called the “K-12 School Shooting Database” has a lot of very compelling visualizations and is widely cited by blue media, but the devil is in their methodology:
The K-12 School Shooting Database is a widely inclusive, open-source research project that documents when a gun is fired, brandished (pointed at a person with intent), or bullet hits school property, regardless of the number of victims, time, day, or reason.
So they produce graphs which make it seem like there are 300+ school shooting instances per year, which are then used by antigun media to stoke fear, but they’re including things like “kid fires BB gun at possum in football stadium,” and “kid shows gun to a friend in school parking lot,” as well as “two gangs face off on school property at night instead of off school property,” as if the location of the gang faceoff mattered.
What people think of when they think of “school shooting” is unprovoked mass killing sprees of random school kids, and there are far fewer of those. Wikipedia keeps a list. Truncated to grade school shootings, the list looks like this since 2012:
In an 11 year span we have eight incidents and 99 deaths, averaging 9 deaths per year. How likely is your kid to be one of those deaths? According to the 2023 census, we currently have 54.2 million students in grade school in the United States, which means there are 1.66 spree shooting deaths per year for every ten million grade school students. That’s a hard number to understand, because nobody can visualize what ten million grade school students looks like, so instead we’ll compare to airline flights as our baseline.
Fiery Airplane Crash Math
Pulling From Statista, we have an average of 473 worldwide air traffic fatalities per year from 2006 to 2021.
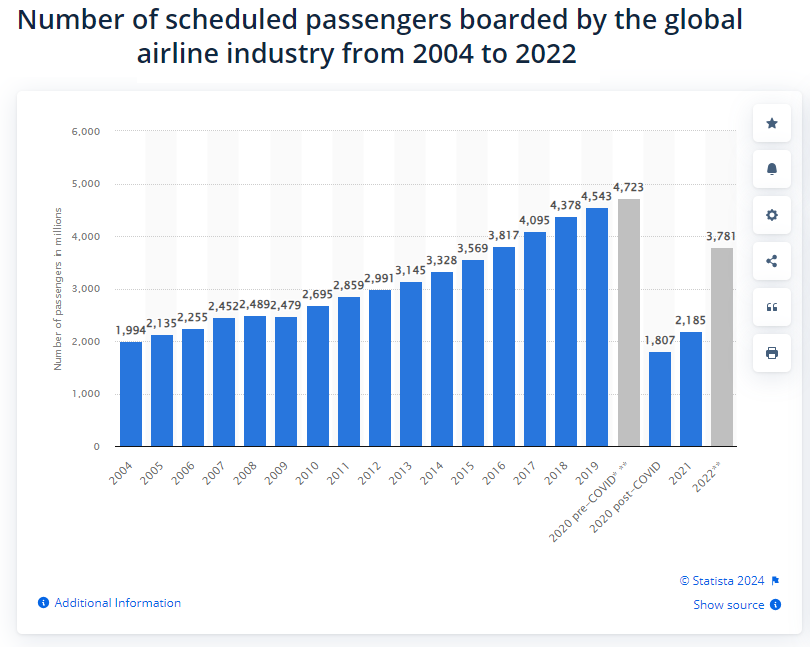
Also from Statista, we can grab the yearly airline passengers across the same time span.
This gives us an average of 3.07 billion passenger trips globally across the same time span as our air traffic fatality data set, for a death rate of 1.54 deaths for every 10 million flights.
It’s almost exactly the same number.
Discussion
Sending your child to grade school in the United States for an entire year is the same risk of death as you taking one single airplane flight.
Pulling your child out of school over the risk of them dying in a spree shooting is just as irrational as never flying again over the risk of an airline crash. Some people make either of these decisions, and making decisions like that is fine, but making one while not making the other flags a person as either irrational or mathematically illiterate.
If you take forty airline flights in your lifetime, you have triple the chance of dying in an airline crash as your child has of being shot in a spree shooting, because there are only 13 grades in grade school.
The average American took 1.5 to 2.1 airline trips per year since 2015, meaning the average American is somewhere between 1.4 and 2 times more likely to die in an airline crash than a kid is to die in a spree shooting.
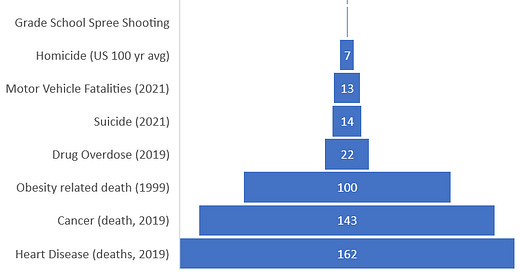
“Deaths per ten million” is a very very low number. Public health usually measures things in “deaths per one hundred thousand,” so to compare this with rates of other instances requires some further unit conversion. Here’s a table:
And a graph:
So the next time someone on social media indicates to you that they are in any way afraid to send their children to grade school out of fear of them being shot, ask them how often they fly. See what they say.


Excellent write up. I think the only way that people could possibly be consistent in terms of "I fly" and "I want to pull my kid out of school to avoid getting them shot" is if they happen to live in a very dangerous school district, of the sort where gang violence in the school is a problem. I could see that, although blaming it on school mass shootings is sort of defining the problem incorrectly on their part.
A couple of things to note: the wikipedia list includes several adults among the victims(and one incident where it seems adults were the targets). This probably makes the actual numerical risk for kids that much smaller. Also, the death rate comparison graph indicates that your health should be a much higher concern than all the other dangers people get panicky about.