This article was originally published on Medium November 30, 2018.
Background
I started writing in March on this topic, and since then I’ve ranged to a lot of other far more interesting things. I don’t even want to write about guns anymore, quite honestly. But this thing keeps cropping up, and I keep feeling obligated to field the discussions over and over. I honestly worry that I failed to communicate why properly before, in the prior series of seven some odd articles, so I hope this one can provide the clarity we all, regardless of our political tribes, need. The whole thing started here:
Everybody’s Lying About the Link Between Gun Ownership and Homicide
290,000 people viewed that article, but I worry that a lot of them, be they blue tribe, red tribe, or anywhere in between, missed the point. The point of that article was this: The media is lying about a bivariate correlation between gun ownership and gun homicide. This thing isn’t simple. There is a slight multivariate correlation, but many other factors are much more important in the overall picture. And I further worry that not enough people read this article:
The Magic Gun Evaporation Fairy
..which talks specifically about the tremendously insane cost of reducing gun proliferation in the USA. It’s simply not mathematically feasible. But these arguments were laid out in different articles, and often aren’t connected, so let’s connect them with some new analysis, and in so doing let’s use the gold standard of multivariate gun analyses as far as I’m aware, which is referenced in the first article.
The AJPH Study
This study published by the American Public Health Association, written by Michael Siegel, Craig Ross, and Charles King III, is widely cited by gun control activists and the left of center media, in gun control articles. It is a very complex, very detailed, multivariate analysis of gun homicide, which is the only appropriate way to tackle the question. I have a few qualms about their methodologies, which I went into in the first article linked above, but let’s set every single qualm aside and take it completely at face value for the duration of this article. Important quotes from the study:
Because no annual survey assessed the level of household firearm ownership in all 50 states during the entire study period, we used a well-established proxy: the percentage of suicides committed with a firearm (firearm suicides divided by all suicides, or FS/S). This measure has been extensively validated in the literature13,14,32,37,44,50–54 and has been determined to be the best proxy available of many that have been tested. 50
I find this approach slightly sketchy, because the ratio of firearm suicides to total suicides is probably heavily culturally influenced. It’s also tremendously warped by gender, which we spoke about here:
The Left Is Making the Wrong Case on Gun Deaths. Here’s a Better Case.
But let’s accept it at face value and move on.
We controlled for the following factors, which have been identified in previous literature as being related to homicide rates: proportion of young adults (aged 15–29 years), proportion of young males (aged 15–29 years), proportion of Blacks, proportion of Hispanics, level of urbanization, educational attainment, poverty status, unemployment, median household income, income inequality (the Gini ratio), per capita alcohol consumption, nonhomicide violent crime rate (aggravated assault, robbery, and forcible rape), nonviolent (property) crime rate (burglary, larceny–theft, and motor vehicle theft), hate crime rate, prevalence of hunting licenses, and divorce rate. To account for regional differences, we controlled for US Census region. In addition, to capture unspecified factors that may be associated with firearm homicide rates, we controlled for the annual, age-adjusted rate of nonfirearm homicides in each state. We also controlled for state-specific incarceration rates and suicide rates.
Good. This is the important part. The reason why there’s no bivariate correlation between gun ownership and gun homicide is that there are so many other moving parts. When outlets such as Vox, Mother Jones, and Everytown for Gun Safety show you these bivariate graphs, they’re lying, and the AJPH study exposes that mistake.
I’ll say one thing, though, that frustrates me about all the gun studies I’ve read since I started writing about this thing. Not one study seems to look at religiosity at a zip code level. I’d love to see that, because the historic trends of “ditching church” and “shooting people” seem to match in this country, at least from the 1960s to the 1990s. Moving on.
The final GEE negative binomial model revealed 6 significant predictors of firearm homicide rates: gun ownership proxy (IRR = 1.009; 95% CI = 1.004, 1.014), percentage Black, income inequality, violent crime rate, nonviolent crime rate, and incarceration rate (Table 2). This model indicates that for each 1 percentage point increase in the gun ownership proxy, the firearm homicide rate increased by 0.9%.
This is the number we’re going to use down below in our analysis today. Please note however that many of the other factors in Table 2 ended up being far more predictive of gun homicide than gun ownership. Here’s Table 2:
The bolded bit in the quote above is re-quoted often by the media in favor of reduction in gun proliferation, often without an understanding of what it really means, because of the way rates are expressed. In 2017 there were 10,982 firearm homicides, which is a rate of 3.38 per 100,000 inhabitants. Many media consumers forget that that’s a ratio, and not a percent. When they see “3.38” and “reduction of 0.9” in the same article, they think that a reduction of 0.9 is large. It’s not. The firearm homicide rate, converted to percent, is 0.00338%, and the 0.9% reduction is 0.009 times that, or a reduction of 0.0000304%. Let’s play with this number for a bit, try and understand it, and try to understand what kind of marginal gains we can get through a policy of gun buybacks or gun seizures, on the presumption that the AJPH model is predictive.
Analysis
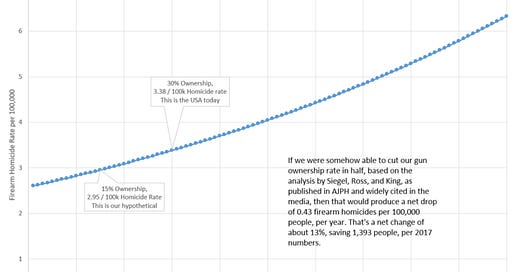
Let us presume that everything in the AJPH study is not only true, it’s predictive of future cases. Let us presume that the 0.9% reduction in homicide rate per 1% change in ownership rate is marginal, meaning it applies at any 1% step up or down along a function that correlates gun ownership and gun homicide, no matter where we are on that function. Let us start with a United States ownership rate of 30%, and a gun homicide rate of 3.38/100k, as is widely cited in the media. Let’s draw that graph, and then let’s hypothesize that we can (somehow) cut the ownership rate in half through policy.
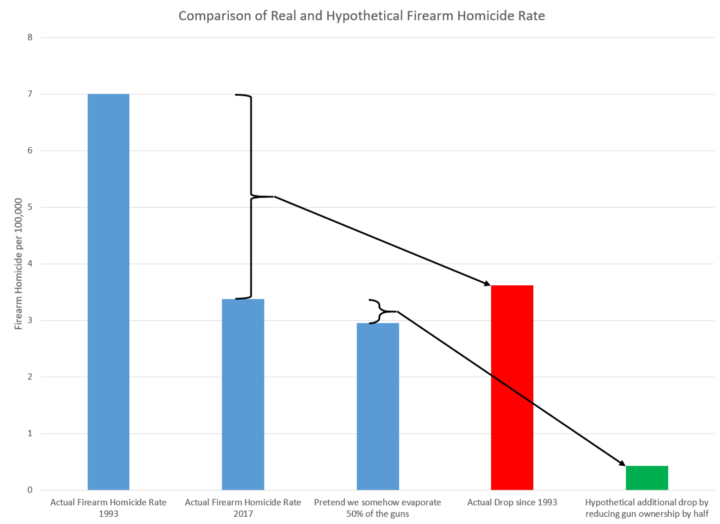
We experience a total net drop in firearm homicide rate of 0.43 victims per 100,000 by cutting our gun ownership rates in half, from 30% to 15%, if we presume the AJPH model is predictive. This would save 1,392 people per year, based on 2017 numbers.
Please be clear: firearm homicide victimization rate since the 1990s in the United States has fallen around 8 times this much, with no firearm ownership reduction program at all. Things today actually aren’t all that bad, historically speaking.
Now let’s talk about buying these guns back. The Australia gun buyback that everybody loves referencing only collected between 20% and 40% of their firearms. If we ran a buyback today, some people with only one gun would take advantage of the buyback, and they would reduce the ownership rate for the cost of one gun. Some with multiple guns would sell them all back, also reducing the ownership rate, at the cost of more guns. Some people with multiple guns would sell some of their guns back, and use the money to buy ammo for their other guns, not affecting the ownership rate at all. Some “super-owners” would sell maybe a quarter or a third of their guns back, and pay off their truck, also not affecting the ownership rate at all. It’s hard to say how many guns you’d have to buy back to get the ownership rate to drop by half, but let’s presume for the sake of argument that you’d have to buy back half the guns. This is probably low. You’d also have to pay at least going rate for these things, or you’d have a revolt on your hands. (you may have one anyway)
So that’s, spit balling, 160 million of the (possibly?) 320 million guns out there, at $750 a gun. Cost for the buyback is $120 billion dollars, to save 1392 lives, for a net of $86 million dollars per single life saved.
And that’s based on a tremendously huge presumption — that the potential murderers in the public are willing to sell back their guns at the same rate that grandma is. That’s almost assuredly not the case, given how such a large number of guns used in homicides originate from sources other than grandma. The overwhelming majority of the people who would sell themselves out of gun ownership through this program are people who aren’t going to shoot anyone anyway, which means the 0.9% AJPH number, even if we presume is predictive of the current case, is very likely not predictive of the future case.
Now let’s go back to Table 2. Do we think that maybe, just maybe, that $120,000,000,000.00 might be better spent on something that’s more predictive to gun homicide than gun ownership? I would imagine we might be able to put a dent in income inequality with that. Or we could address the ails of the black male community with it, who are the ones getting disproportionately shot by a wide margin. What if we threw that money at police, while simultaneously ending the drug war and bringing the baby daddies back home to get jobs and provide for their families, reducing the single parenting rate among inner city communities?
There is no world in which the idea of reducing crime via reducing gun proliferation makes any sort of mathematical sense, given who we are and where we’re at as a nation, and that mathematical reality should be something that people of all tribes, blue or red, can realize.
If they just understood the data.


