Everyone is Lying about NYC’s Racial Diversity
A mathematical look at a common term with no common definition
Sitting in Mary Mac’s Tea Room yesterday in downtown Atlanta with my girlfriend and her Beverly Hills grade school friend, I commented that Atlanta was the most racially diverse city in the country. They both balked, whipped out their phones, and pointed to a wall of articles stating emphatically that no, in fact New York City was the most racially diverse. Surrounded by black folks, eating southern food, with photos of MLK and Jimmy Carter on the walls, my incredulity could barely be contained. I whipped out my phone, pulled up data showing that Atlanta had over double NYC’s black population rate. Then I checked their articles and realized that nobody was telling anyone else what “diversity” meant, nor how it was calculated. As a word without a definition cannot be debated, I scratched my head, dropped the whole thing, and whipped out Excel this morning when I woke up.
I discovered that under only torturously stretched circumstances is NYC the most racially diverse metro area in the country, but neither is my home town of Atlanta except under a very narrow definition. I further discovered that the only way any major metro city in the north could be considered “diverse” is if you ignore basically all of the minorities in the southeast and southwest, if we go with “normal” definitions. As I dug further, I was able to peel apart exactly the sort of statistical chicanery required to place NYC at #1.
For all our analysis today, we’ll be using numbers from the Brookings Institute 2020 Census Portrait of America’s Largest Metro Areas.
Racial Diversity #1 - “Black”
When the great “being black in Starbucks” fiasco hit the national news, it flabbergasted me. If you missed it, two black dudes in Philly went to Starbucks for a business meeting and the barista called the cops on them for, according to some perspectives, “being black in Starbucks.” Details of the fiasco aside, I couldn’t understand how something like that could happen anywhere. When I go to Starbucks in Atlanta a third of the clientele are black, a majority of the baristas are black, and half the cops are black. I didn’t process that any place existed where black people in Starbucks were unusual. It took me a bit to understand that Atlanta may be a relatively unique place in the USA. The most violent Black Lives Matter protests in 2020 were in Portland and Seattle, which begins to make sense when you realize that most of those protesters have probably never even seen a black person up close.
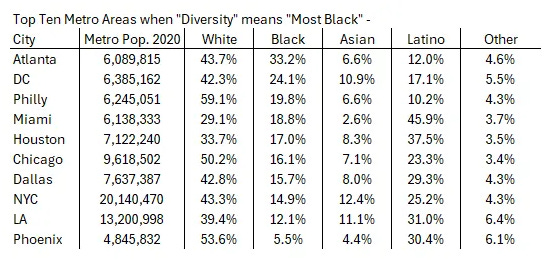
Some people think that “diversity” is a measure of black population ratio. That definition could be good or bad, or useful or not, but when we rank the top ten metro areas by diversity when diversity means “black people,” here are the results:
Atlanta is the “most diverse” by a wide margin, New York City is in the bottom third. When people say “New York City is the most diverse,” they clearly don’t mean it has any more black people in it than anywhere else. It’s only a couple percentage points above the national average.
Racial Diversity #2 - “Not White”
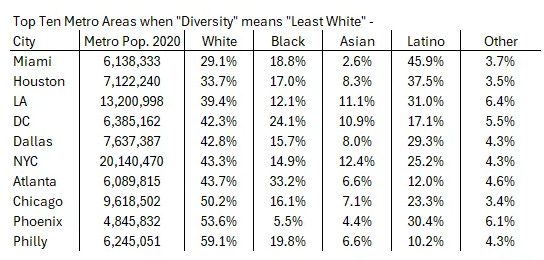
The nation is 57.8% white, and it is very common for people to think that “diversity” means “not white.” This definition seems popular on the west coast, where for instance an Oregon school board claimed “100% Diversity” for having no white people on it. This also seems to be the Hollywood definition, as evidenced by UCLA’s 2023 Hollywood Diversity Report, which is just a way to track how many roles go to white people and not-white people. If we adopt this definition of diversity, we can again rank the top ten metro areas in the USA.
The most diverse city is Miami by a huge margin because it’s half Latino. Houston and LA round out the top three for similar reasons. NYC and Atlanta are basically tied in the middle of the pack, so New York is clearly not the “most diverse” by this metric. Curiously, the most diverse city by this metric outside the top ten metro areas is Honolulu.
So “diverse” doesn’t mean black, because then Atlanta would win, and it doesn’t mean “not white” because then Latino dominated areas would win. How is New York City winning this contest when it’s only 3% off the national average for black population and 6% off the Latino national average?
Racial Diversity #3 - “Not White or Asian”
The recent Supreme Court case overturning the “affirmative action” defacto racial quotas at Harvard, the University of North Carolina, and by extension everywhere else, showed that universities were “promoting diversity” by taking a small but real number of slots from whites by ratio, and an extremely large number of slots from Asians by ratio, and giving them to blacks and Latinos. Mathematical analyses of admissions presented in the court trial indicated that whites by merit were underrepresented in Harvard classes by a little under five percent, but asians were underrepresented by 40% or more. Admitting to being Asian on your application was equivalent to a several hundred point hit on your SAT score. Adam Mortara tells the gory details to Wesley Yang on his Year Zero podcast here, if you haven’t seen it:
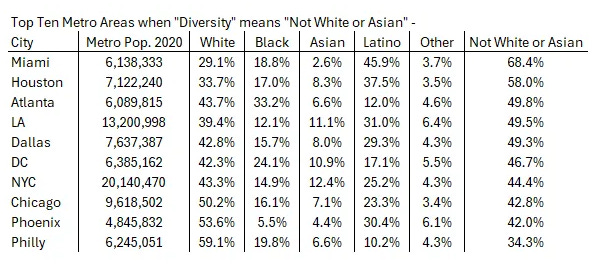
“Diversity” within college admission boards means “not white and not Asian,” but when we rank the metro areas by the college definition New York still does very poorly because it has more Asians than many other places.
Again Miami and Houston kill it because of the Latinos, and Atlanta jumps LA because LA’s Asians no longer give them any boost. New York City again falls into the bottom half of the list.
At this point in our thought experiment New York occupies the bottom half of three consecutive lists.
Racial Diversity #4 - “Divergent From the US Average”
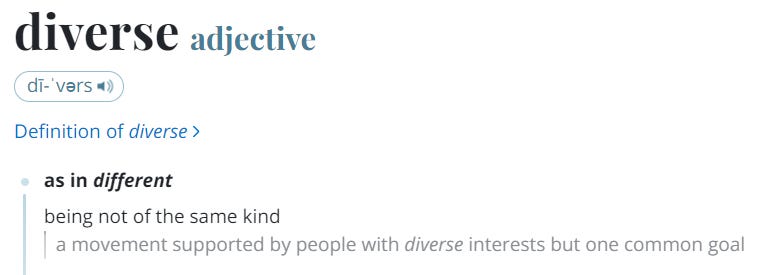
Websters defines “diverse” as being “different,” or “not of the same kind.”
One could conceivably state that a city is racially diverse if its demographics diverge from the national average. We could compare each of the top ten metro areas racial demographics to the national average, calculate the delta, and sum the deltas to see which city has the greatest divergence from the US average, meaning it’s the most different.
Again we see the same theme. Miami, Houston, and Atlanta are again the top three for the same reasons, lots of Latinos in the first two and a hell of a lot of black folks in Atlanta. Again New York is bottom-middle. But this calculation presumes that a differential from the white average would also make a city “different,” and some folks very much dislike the idea that any sort of white presence could potentially increase your diversity score in any way, so we can recalculate it without whites in the tabulation at all.
New York is even worse in this tabulation. Its divergence of non-whites from the national average is second worst only to Chicago in the top ten metro areas, while Atlanta jumps to the #2 spot because Houston earned a lot of credit in the first of the two tabulations for having so few white people.
New York City, by any measure of diversity I can contrive, is milquetoast at best.
NYC’s Mystery Diversity
New York City is not diverse because of black people, not diverse because of nonwhite people, not diverse according to the college “not-white-or-Asian people” standard, and not significantly different than the national average, counting or not-counting white people, so it fails on the Webster definition as well. So where’s Google getting this garbage?
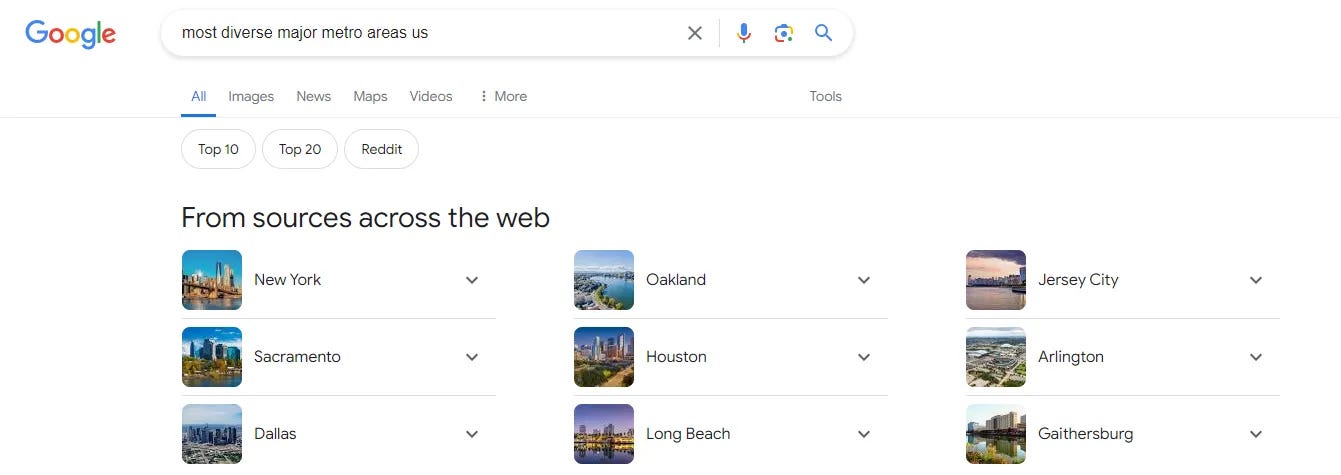
Forbes has NYC at #1 in diversity, referencing an analysis at Statista. Katharina Buchholz at Statista claims to have done basically what I did, but somehow got very different results.
Katharina is a deeply connected World Economic Forum contributor and her brief stint on Medium seemed like a regurgitation of Every Popular Medium Thing Ever.
Rocket Mortgage lists NYC as the top among its list when pruned to major metro areas. Their article doesn’t list a methodology, and was written by a lady from Detroit who lives in Richmond Virginia. I highly suspect that both Detroit and Richmond rank higher than NYC by any of the methodologies I attempted above, and based on her profile I suspect that author might have a great time living in Atlanta. I can’t figure this one out.
Wallethub has NYC as #1 for etho-racial diversity but doesn’t explain their methodology either. That article was part of a series, most of which was piloted by a lady who lives in rural Minnesota.
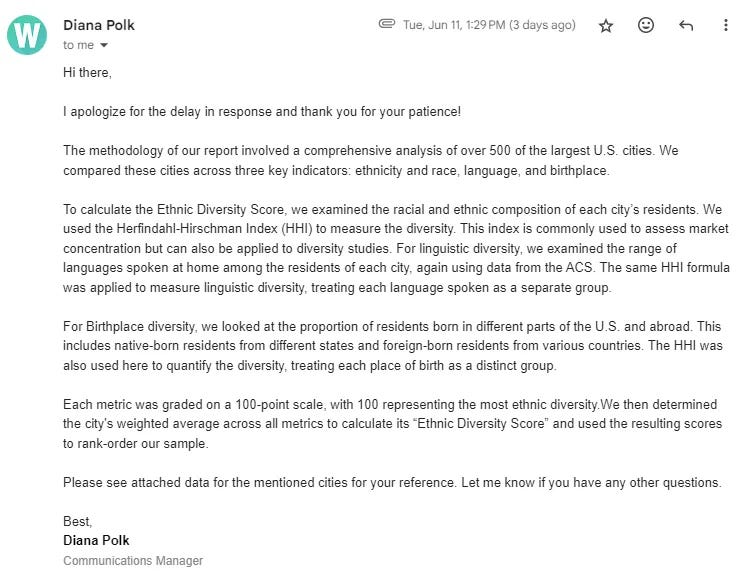
I thought at first this strange drive to misclassify NYC as “diverse” was due to New York centric media bias, but that doesn’t appear to be the case. I reached out to each of these authors to ask them to share their methodology, and only Wallethub replied back. Their reply both fascinated me and educated me on some new concepts.
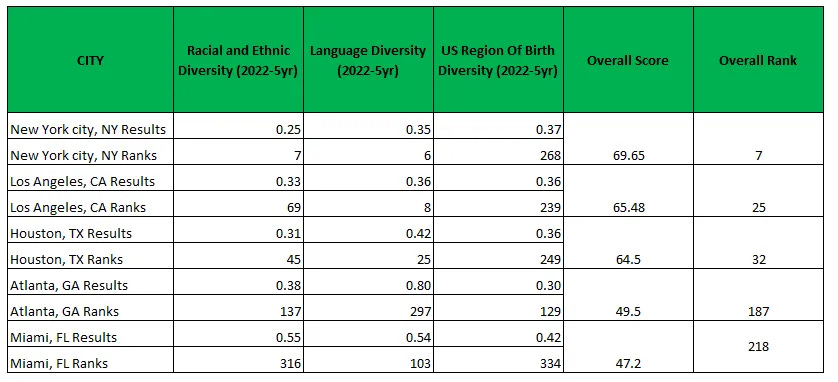
Wallethub was also kind enough to send me a quick spreadsheet of some of their results. They didn’t share the root data, but I was able to replicate what they did from what they sent. This is what they sent me:
Herfindahl-Hirschman Index is a financial formula used to gauge how much competition is in a market sector, and is an important element that the SEC uses to evaluate corporate mergers.
Looks complicated, but it’s very simple. Take all the percentages of different races we have in our tables above, which represent a kind of a “racial market share,” square each, and sum the results. The answer is between 0 and 1, with low numbers being more diverse and high numbers being more “monopolistic,” or in this case racially homogenous. So surely after we do that we’ll find NYC at the top.
Nope.
Philadelphia is less diverse than the USA itself is by this HHI standard, even with a 19.8% black population rate.
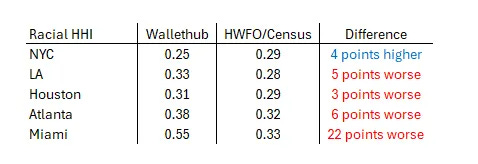
My calculations are based on 2020 census numbers used in the above linked Brookings Institute report, and Wallethub’s are based on some flavor of five year rolling average for 2022, so our data origins might be different. That’s not fully explanatory for the differences in results, though, which in some cases are cavernous.
Wallethub’s calculation places NYC better than the 2020 census score, and every other city I crosschecked worse than the 2020 census score. It puts Atlanta significantly worse, and Miami incredibly worse than the score HWFO calculated from raw census data, on which the Brookings Institute Diversity Report was based. This doesn’t seem like a function of different data sets to me, especially in the case of Miami. Whatever the mysterious calculation difference is, it’s clearly favoring New York.
Furthermore, racial and ethnic diversity is only one third of the Wallethub calculation. They did three calculations, one for racial and ethnic diversity, one for language diversity, and one for diversity in the US region of birth of the population. Atlanta actually beat all the other crosschecked cities on birthplace diversity, because as anyone in Atlanta knows, basically nobody’s actually from here. But New York kills everyone else outside of LA for language diversity, and when combined with their highly curious and not-entirely-replicable racial diversity score, they jump into the #1 spot. Atlanta gets dinged because whoever doesn’t speak English here at least speaks Spanish.
Based on back-calculating the “overall score” in the Wallethub table, it appears that each of these three categories, “Racial and Ethnic Diversity,” “Language Diversity,” and “US Region of Birth Diversity,” are weighted approximately equally in Wallethub’s ranking system.
To summarize, the one system favoring NYC I was able to pick apart had (1) some mysterious differences with their stated methodology that bumped NYC and dinged everyone else, (2) Included two other factors, language and region of domestic birthplace, and (3) weighted all three factors the same.
And that’s how NYC claims the top spot in these rankings. Mostly by having a higher ratio of foreigners who don’t speak English particularly well.
Which is curious, because that’s not what the colleges think “diversity” is when they torpedo Asian applicants, not what the social justice protesters think “diversity” is when they march for Black Lives, not what Hollywood thinks it is when they push for more non-white acting roles, and not what Oregon school boards think it is when they claim “100% diversity” for having a school board made of nonwhite locals.
It’s almost as if “diversity” means whatever anyone needs it to mean at any given time to push their daily agenda of convenience.









Best quote I've seen this week:
'It’s almost as if “diversity” means whatever anyone needs it to mean at any given time to push their daily agenda of convenience'
I feel like you missed a very obvious "definition of diversity" that New York might win:
Most People
Or also:
Most different ethnicities/languages represented
Or also (hat tip to the MIB movies):
Most aliens disguised as people.